Introduction
In this example, we use Pyromat® data files that have been converted to standard text format [Alan K. Burnham, ”Pyrolysis Kinetics for the Bakken Shale”, Lawrence Livermore National Laboratory Report UCRL-ID-109622, 1992] and [Jerry J. Sweeney, William D. Gosnold, Robert L. Braun, and Alan K. Burnham, ”A Chemical Kinetic Model of Hydrocarbon Generation from the Bakken Formation, Williston Basin, North Dakota”, Lawrence Livermore National Laboratory Report UCRL-ID-112038, 1992].
The files used in Case 2 can be downloaded as: bakken.zip . All included files are text files and should be extracted to a user data folder that is not a subfolder of C:\Program Files.
| File Name | Description |
| BAKK3.dat | Pyrolysis data at a nominal heating rate of 3 C/min |
| BAKK8.dat | Pyrolysis data at a nominal heating rate of 8 C/min |
| BAKK20.dat | Pyrolysis data at a nominal heating rate of 20 C/min |
| BAKK50.dat | Pyrolysis data at a nominal heating rate of 50 C/min |
| BAKK-A.con | Kinetics05 command file for Analysis calculation |
| BAKK-A.out | Output file from Analysis calculation |
| BAKK-A.dup.out | Duplicate of output file from Analysis calculation |
Analysis with Discrete Model
This example uses the Discrete model (i.e., single frequency factor and discrete E-distribution) to analyze data from pyrolysis of Bakken Shale. The Discrete model is often the best kinetic model to analyze petroleum source rock pyrolysis data.
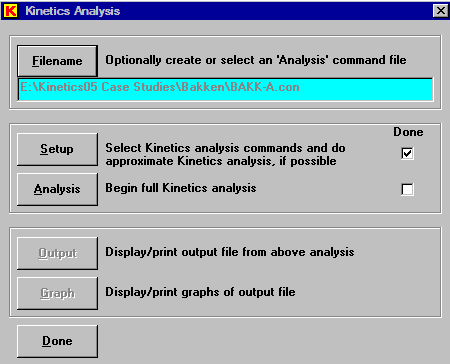
Click ”Filename” and select the Analysis command file BAKK-A.con. Since this command file already exists, the ”Analysis” button will already be enabled. However, the ”Setup” function can still be used to either view or change the settings. Once the analysis calculations are completed for this ”con” file, the ”Output” and ”Graph” buttons buttons will become enabled.
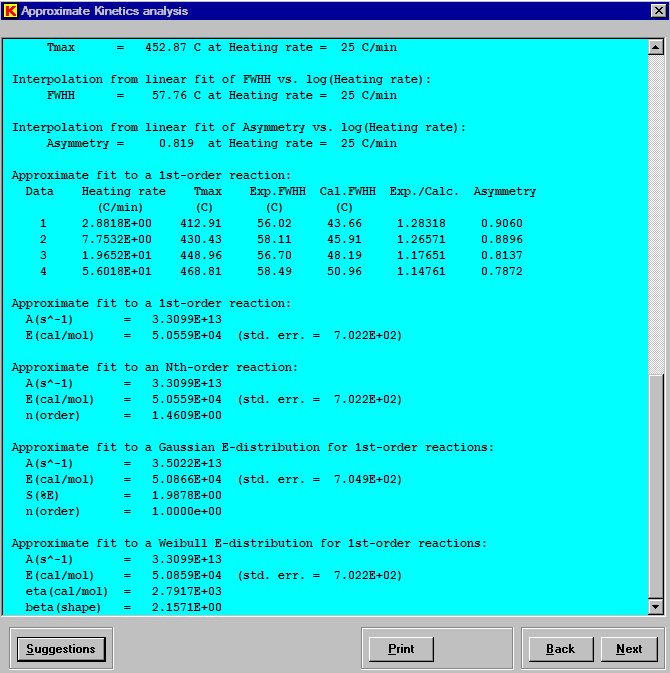
Clicking ”Setup” in the main control window displays the following analysis setup window, which shows the selections that are used in the present command file.

Clicking the ”Next” button in the analysis setup window causes a series of approximate analyses to be done and displayed, when possible. This is a portion of the information displayed.
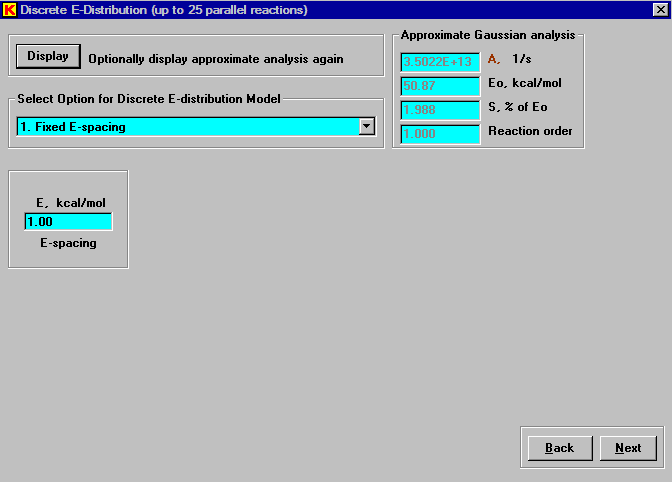
Clicking the ”Next” button in the approximate analylses window, displays the following window for entering options for doing a ”Discrete” analysis. When possible, the simplest option 1 using fixed E-spacing should be selected, because it give the greatest flexibility in determining the fit. Up to 25 parallel reactions can be used in the fitting procedure and a spacing of 1 kcal/mol will usually span most reaction peaks.
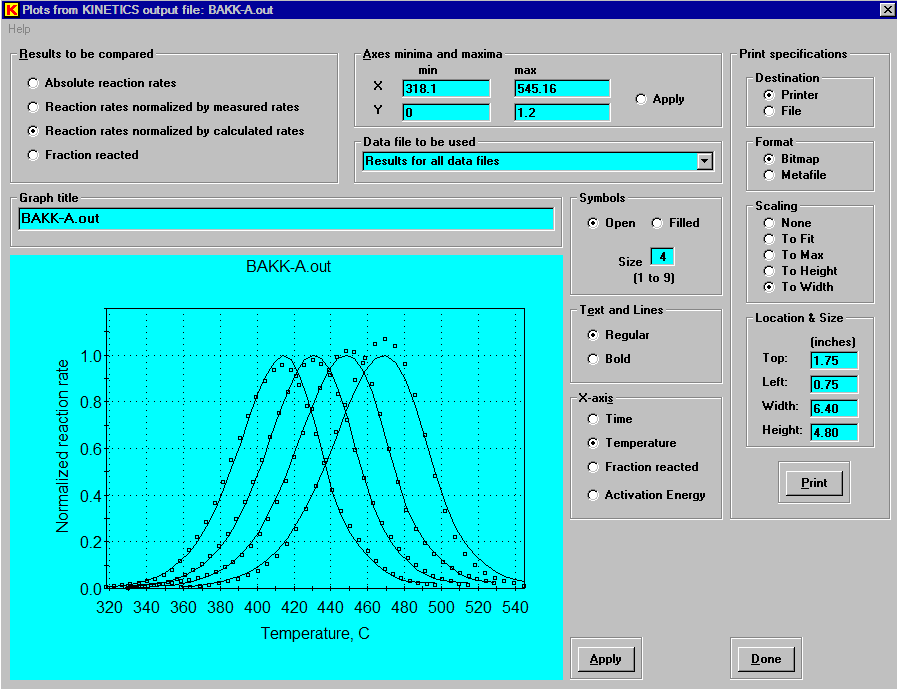
Clicking the ”Next” button in the discrete setup window initiates the Kinetics calculation and displays the default graph of normalized reaction rate as a function of temperature. The ”Discrete” model fits the Bakken pyrolysis data very well.
Clicking the ”Activation Energy” radio button in the graph window displays the discrete E-distribution that was derived in this calculation.
