Introduction
For some materials, although a discrete distribution of activation energies gives the best fit for pyrolysis data, a reasonably good fit can be obtained with a much simple model; namely a single 1st-order reaction or a single nth-order reaction. Pyrolysis data for Estonian Kukersite is a prime example of this.
In this example, we use Pyromat® data measured for Kukersite [Alan K. Burnham and Robert L. Braun, ”Global Kinetics Analysis of Complex Materials”, Energy & Fuels, Vol. 13, No. 1, pp. 1-22, 1999].
Also, for comparison, we use Pyromat® data measured for Monterey Shale, a more typical material that does not follow a single 1st-order reaction well [John G. Reynolds, Alan K. Burnham, and Thomas O. Mitchell, ”Kinetic analysis of California petroleum source rocks by programmed temperature pyrolysis”, Org. Geochem. Vol. 23, No. 2, pp. 109-120, 1995].
The files used in Case 3 for both Kukersite and Monterey can be downloaded as: kukersite.zip. All included files are text files and should be extracted to a user data folder that is not a subfolder of C:\Program Files.
Pyrolysis data
| Kukersite | |
| KUKE01AD.dat | Nominal heating rate of 1 C/min |
| KUKE07AD.dat | Nominal heating rate of 7 C/min |
| KUKE50AD.dat | Nominal heating rate of 50 C/min |
| Monterey | |
| TM0301AA.dat | Nominal heating rate of 1 C/min |
| TM0307AA.dat | Nominal heating rate of 7 C/min |
| TM0350AB.dat | Nominal heating rate of 50 C/min |
Single 1st-order reaction
| Kukersite | |
| KUKE-A.con | Command file |
| KUKE-A.out | Output file |
| KUKE-A.dup.out | Duplicate of output file |
| Monterey | |
| TM03-A2.con | Command file |
| TM03-A2.out | Output file |
| TM03-A2.dup.out | Duplicate of output file |
Single nth-order reaction
| Kukersite | |
| KUKE-B.con | Command file |
| KUKE-B.out | Output file |
| KUKE-B.dup.out | Duplicate of output file |
| Monterey | |
| TM03-B2.con | Command file |
| TM03-B2.out | Output file |
| TM03-B2.dup.out | Duplicate of output file |
Discrete model (single frequency factor and discrete E-distribution)
| Kukersite | |
| KUKE-C.con | Command file |
| KUKE-C.out | Output file |
| KUKE-C.dup.out | Duplicate of output file |
| Monterey | |
| TM03-C2.con | Command file |
| TM03-C2.out | Output file |
| TM03-C2.dup.out | Duplicate of output file |
Kinetics Analysis with 1st-Order Model
One of the simplest models for kinetics analysis is a single 1st-order reaction. Such a simple model does not fit most petroleum source rocks. Kukersite is one source rock whose pyrolysis data are almost fit by this simple model. The fit for Kukersite will be contrasted with the very poor fit for Monterey, typical of most source rocks.
Kukersite
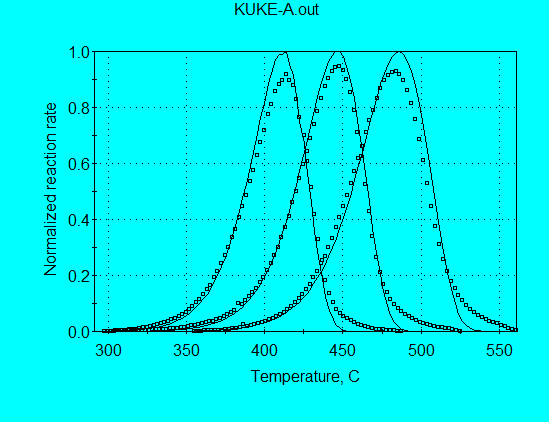
Application of this model for analysis of Kukersite pyrolysis data (using command file KUKE-A.con) gives:
A = 4.40 E+13 s-1
E = 52.28 kcal/mol
The A and E are in the correct range of values expected for petroleum source rocks. The calculated and measured reaction rate profiles are compared in the following graph, in which it is seen that the full width of the profiles at half height (FWHH) are in substantial agreement. However, the peak locations are in agreement only for the middle heating rate. Therefore, use of the parameters from this model would still not be acceptable for use in extrapolating to geologic heating rates.
Monterey Shale
Application of single 1st-order reaction model for analysis of Monterey pyrolysis data (using command file TM03-A2.con) gives:
A = 2.04E+10 s-1
E = 40.63 kcal/mol
The A and E are both abnormally low, in attempt to achieve the best fit by broadening the calculated reaction profile. Even then, the calculated profile is significantly narrower than the measured profile, as shown in the following graph. Furthermore, the calculated peak locations are in very poor agreement, rendering this model completely worthless for extrapolation to other heating rates. This is typical of application of this simple model to most petroleum source rocks.
Kinetics Analysis with Nth-Order Model
An improvement over the single 1st-order reaction model that can readily be done is the single nth-order reaction model. This will be illustrated for both Kukersite and Monterey.
Kukersite
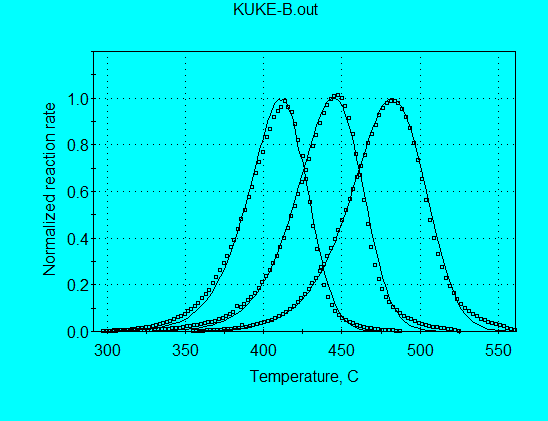
Application of the nth-order model for analysis of Kukersite pyrolysis data (using command file KUKE-B.con) gives:
A = 2.49 E+14 s-1
E = 54.58 kcal/mol
n = 1.238
The A and E are now very consistent with values expected for petroleum source rocks. As shown in the following graph, the calculated and measured reaction rate profiles are in good agreement and the FWHH are in excellent agreement. The parameters from this model would probably be acceptable for use in extrapolating to geologic heating rates.
Monterey Shale
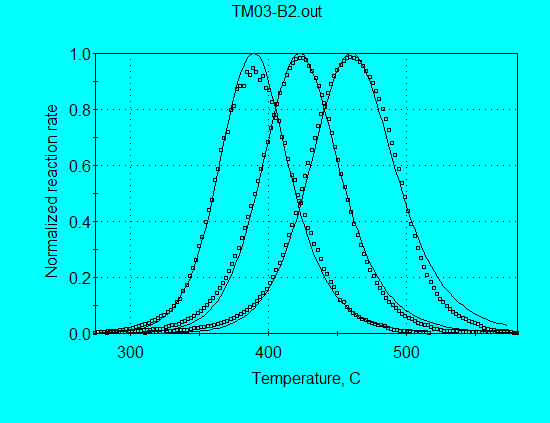
Application of this model for analysis of Monterey pyrolysis data (using command file TM03-B2.con) gives:
A = 3.68 E+13 s-1
E = 50.32 kcal/mol
n = 2.058
The A and E are still somewhat low for a petroleum source rock, again in attempt to achieve the best fit by broadening the calculated reaction profile. Even then, the calculated profiles are slightly narrower than the measured profiles, as shown in the following graph. Much better fit of the data is obtained with discrete E-distribution, as will be seen.
Kinetics Analysis with Discrete E-distribution
An improvement over the single 1st-order reaction model that can readily be done is the single nth-order reaction model. This will be illustrated for both Kukersite and Monterey.
Kukersite
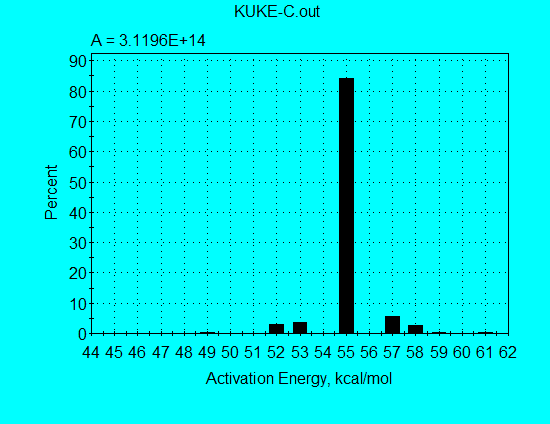
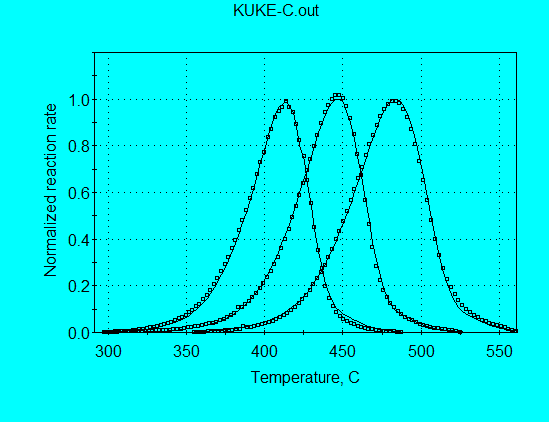
Application of the discrete E-distribution model for analysis of Kukersite pyrolysis data (using command file KUKE-C.con) gives the kinetics parameters shown in the following graph. A single E = 55 kcal/mol accounts for 84% of the reaction, illustrating why a single 1st-order reaction was almost able to fit the pyrolysis data. Furthermore, there are similar minor contributions at E’s on both sides of the principal E, illustrating why a single nth-order was able to fit the data quite well.
As shown in the following graph, the calculated and measured reaction rate profiles are in very good agreement, with both the FWHH and the peak locations in agreement at all heating rates. Therefore, the parameters from the discrete E-distribution model would be superior to the parameters from the single nth-order model for use in extrapolating to geologic heating rates.
Monterey Shale
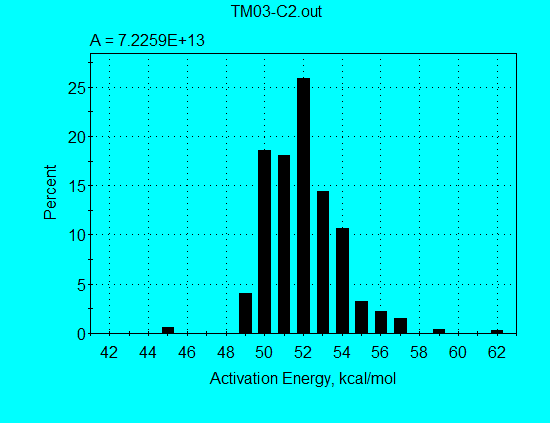
Application of the discrete E-distribution model for analysis of Monterey pyrolysis data (using command file TM03-C2.con) gives the kinetics parameters shown in the following graph. This broad E-distribution illulstrates why a single 1st-order reaction failed completely in simulating Monterey pyrolysis data.
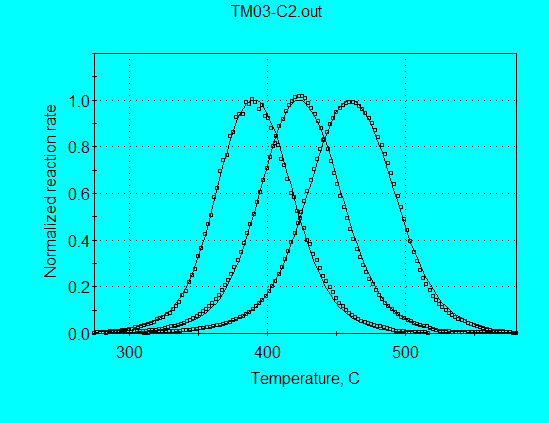
As shown in the following graph, the calculated and measured reaction rate profiles are in very good agreement, with both the FWHH and the peak locations in agreement at all heating rates. Therefore, the parameters from the discrete E-distribution model would be superior to the parameters from the single nth-order model for use in extrapolating to geologic heating rates.


