Introduction
While the broadness of the pyrolysis profile of most kerogens is described well by a parallel reaction model, the pyrolysis profile at a constant heating rate for certain well-preserved algal kerogens is narrower than can be described by a single first-order reaction or a single nth-order reaction. Pyrolysis data for Frejus, a boghead coal from the “Mines de Boson” region in France, is a prime example of this. Its narrow pyrolysis profiles are fit well by a nucleation-growth model.
In this example, we use fluidized-bed pyrolysis data measured for Frejus [Alan K. Burnham, Robert L. Braun, Thomas T. Coburn, Erik I. Sandvik, David J. Curry, Birthe J. Schmidt, and Rohinton A. Noble, An Appropriate Kinetic Model for Well-Preserved Algal Kerogens”, Energy & Fuels, Vol. 10, No. 1, pp. 49-59, 1996]. One data set is measured for a nominal heating rate of 6 C/min and three data sets are at isothermal conditions of 512 C, 493 C, and 473 C.
The files used in Case 5 for Frejus can be downloaded as: frejus.zip. All included files are text files and should be extracted to a user data folder that is not a subfolder of C:\Program Files.
Frejus Fluidized-Bed Pyrolysis data
| TCAB71c1.dat | Nominal heating rate of 6 C/min |
| TCAB81c.dat | Constant temperature of 512 C |
| TCAB84c.dat | Constant temperature of 493 C |
| TCAB86c.dat | Constant temperature of 473 C |
Single 1st-order reaction
| TCAB-A.con | Command file |
| TCAB-A.out | Output file |
| TCAB-A.dup.out | Duplicate of output file |
Nucleation-Growth Model (3-parameter)
| TCAB-B.con | Command file |
| TCAB-B.out | Output file |
| TCAB-B.dup.out | Duplicate of output file |
Nucleation-Growth Model (4-parameter)
| TCAB-C.con | Command file |
| TCAB-C.out | Output file |
| TCAB-C.dup.out | Duplicate of output file |
Kinetics Analysis with 1st-Order Model
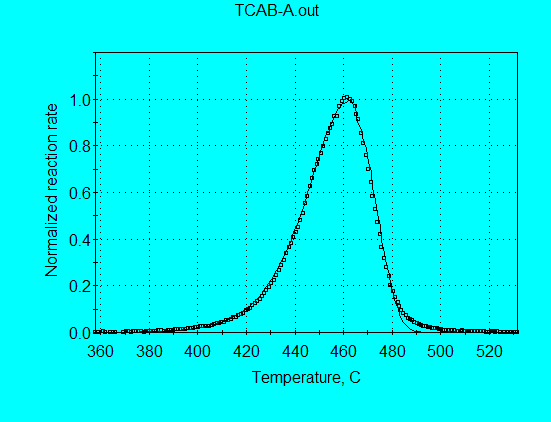
One of the simplest models for kinetics analysis is a 1st-order reaction model. Such a simple model does not fit most petroleum source rocks, although we illustrated in Case 3 that Kukersite is one source rock whose pyrolysis data are almost fit by this simple model. The pyrolysis profiles for some kerogens are even narrower than predicted by a single 1st-order reaction, as we illustrated in Case 4 for GGU24 and will illustrate here for Frejus (using the analysis command file TCAB-A.con). In this example we use only one data set at a constant heating rate. For such a calculation, it is not meaningful to permit both A and E to be optimized simultaneously. Therefore, a reasonable value of A = 1.00E+14 s-1 was used and an optimized value of E = 54.68 was obtained. In the following graph it is seen that the measured profile is significantly narrower than the profile calculated with reasonable 1st-order parameters.
Allowing both A and E to be optimized gives abnormally high values of A = 1.764E+21 s-1 and E = 78.59 kcal/mol. While these values give a calculated reaction profile that agrees closely with the measured profile in the following graph, the values are meaningless for application to other thermal histories.
Kinetics Analysis with Nucleation-Growth Model
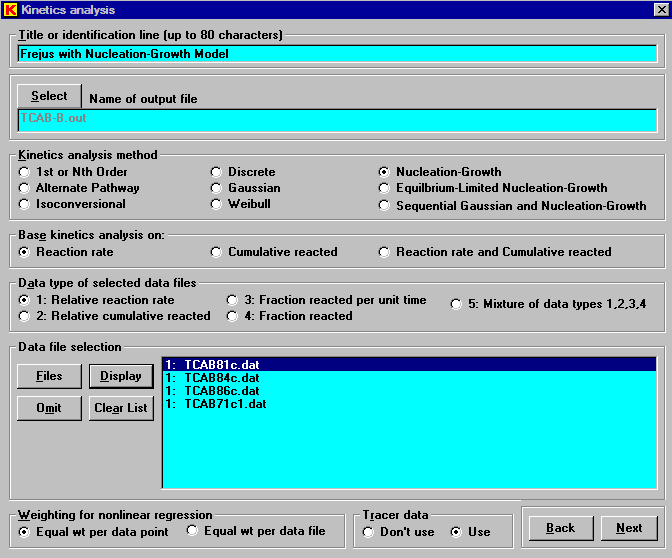
Pyrolysis data for Frejus are fit best by a nucleation-growth model. The analysis setup window is shown here. Both constant heating rate data (TCAB71c1.dat) and isothermal data (TCAB81c.dat, TCAB84c.dat, and TCAB86c.dat) can be analyzed simultaneously.
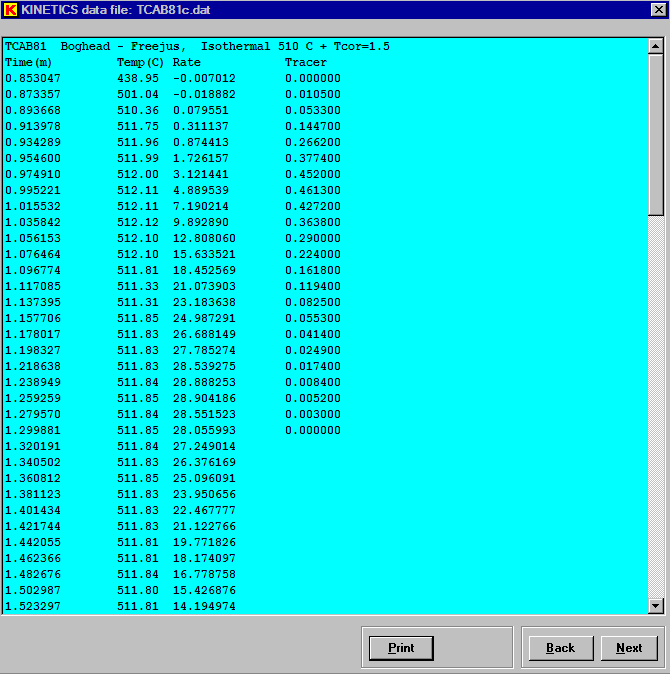
Note that the use of tracer data (near the bottom of the window) is specified. In the isothermal experiments used here, the reaction signal can undergo considerable dispersion before reaching the detector. This can cause serious errors in the data analysis. A tracer signal measured under the same conditions helps quantify and correct for the dispersion. To supply tracer data, a measured tracer signal is entered as the fourth entry in each data line. The tracer data can be rate (pulse) or integral (step), but it cannot be a square wave. The tracer data can be on a relative scale and must be supplied for each experiment in the set being analyzed. Use of the tracer data requires that each data file have a constant time step. Blank entries for the tracer rate are permitted once it has decreased to zero. Kinetics05 permits the use of tracer data only in the nth-order, Gaussian, Weibull, and nucleation analysis methods. The following is a display of the earlyl part of one of the isothermal data files (TCAB81c.dat).
The nucleation-growth model requires a frequency factor (A), a single activation energy (E), a nucleation exponent (m), and a reaction order (n). Analylsis of the Frejus pyrolysis data with fixed n = 1 (using the analysis command file TCAB-B.con) gives the following optimized kinetic parameters:
A = 1.506 E+13 s-1
E = 51.26 kcal/mol
m = 0.4345
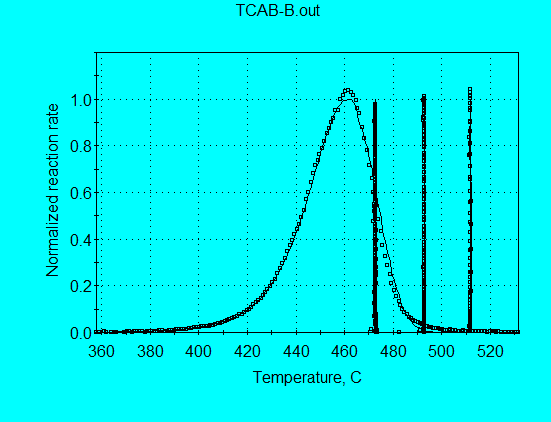
The default graph with X = Temperature shows the good agreement between calculated and measured reaction profile for the constant heating rate data.
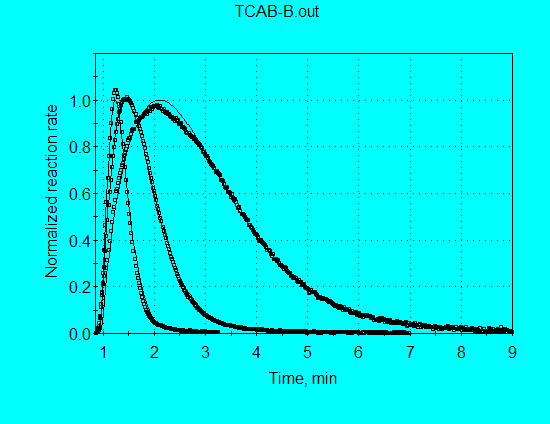
Changing the graph to X = Time (min) shows the agreement for all four data sets.
Restricting X to a maximum value of 9 minutes, gives a better view of the isothermal data comparisons.
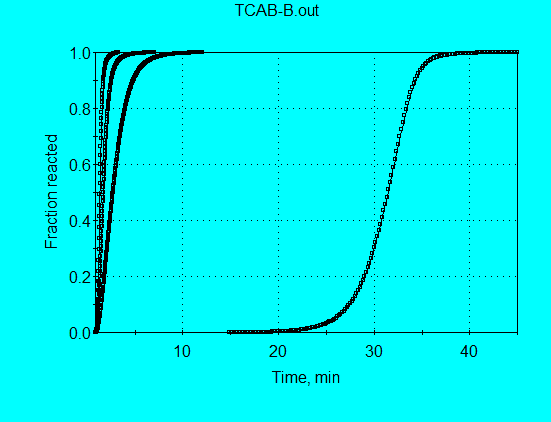
The results of this calculation can also be viewed for Y = Fraction reacted for all four data sets.
Restricting X to a maximum value of 9 minutes, gives a better view of the three isothermal data comparisons.
Simultaneous optimization of all four parameters of the nucleation-growth model gives the following values that are only slightly different from the values for the fixed n = 1 calculation above. However, there was no significant improvement in the agreement of the calculated and measured data.
A = 1.419 E+13 s-1
E = 51.21 kcal/mol
m = 0.4210
n = 0.9667

